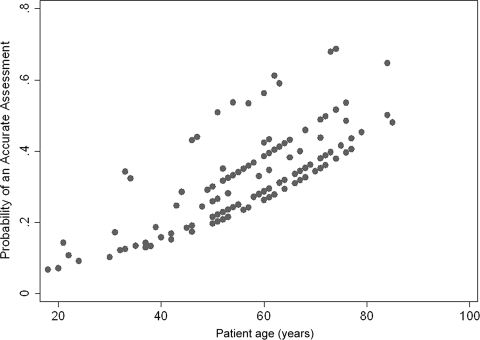
Figure 3.
Accuracy of temporal clinician prediction of survival (CPS) by clinician and patient age. The y-axis represents the predicted values from a multivariate logistic regression examining temporal accuracy of CPS as a function of clinician and patient age. The x-axis represents the actual patient age (in years) for each observation. Patient age was a significant predictor of clinician accuracy (p = .019). On average, a significantly more accurate temporal CPS was provided for older patients than for younger patients, regardless of which clinician provided the estimate.

