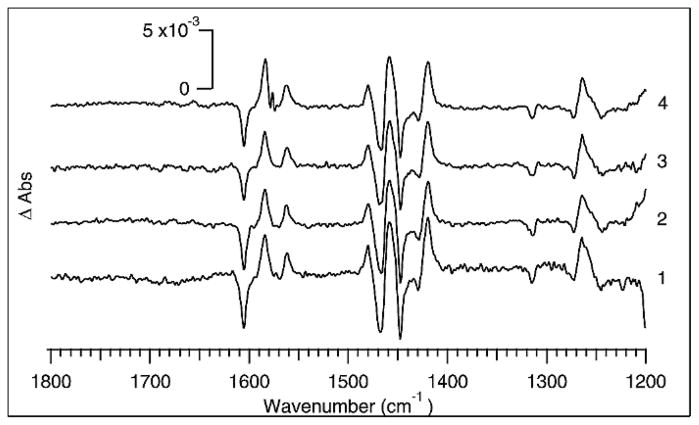
Fig. 4.
Photo-excitation difference spectra of [Ru(bpy)3]2+ obtained using FT-IR scan rates from 200 to 25 Hz while collecting 297 total pulses for each spectrum. At (4) 200 Hz, (3) 100 Hz, (2) 50 Hz, and (1) 25 Hz the boxcars averaged 9 pulses per step and collected 33 scans. A burst of 9 pulses triggered the laser and boxcars. The per-pulse fluence was kept as close as possible to approximately 5.7 mJ/cm2.

