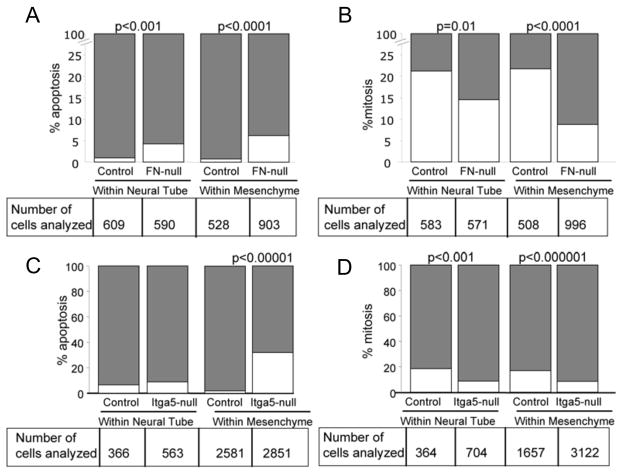
Figure 8. Quantitative analysis of CNC apoptosis and proliferation in FN-null and integrin α5-null embryos at E8.5.
A, B. Decreased survival and proliferation of CNC progenitors and CNCCs in the absence of FN. A. Survival. White bars represent the percent of cleaved caspase 3-positive CNC progenitors or CNCCs and grey bars represent the percent of cleaved caspase 3-negative TFAP2α+ cells. B. Proliferation. White bars represent the percent of pHH3+ TFAP2α+ cells within the dorsal neural tube or mesenchyme and grey bars represent the percent of pHH3- TFAP2α+ cells. Statistics were performed using Z-test for two proportions, chi-square test or Fisher exact test, with similar results. C, D. Survival and proliferation of the CNC in integrin a5-null mutants and controls. The numbers of analyzed TFAP2α+ CNCCs are listed below each graph. Quantification of survival and proliferation are described in the Methods section and were similar to the analysis performed on FN-null and control embryos. Larger number of CNCCs in the mesenchyme of control and integrin α5-null embryos is due to the more advanced developmental stage of these embryos compared with FN-null and control set of embryos.

