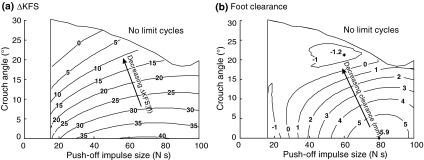
Figure 7.
(a) Contour plot of ΔKFS (increase in knee flexion during swing) as a function of both push-off magnitude and crouch angle. (b) Contour plot of foot clearance as a function of both push-off magnitude and crouch angle. The single effect of crouch angle on ΔKFS and foot clearance (Fig. 4a) and the single effect of push-of magnitude on ΔKFS and foot clearance (Fig. 6a) each represent a cross section of these graphs. ΔKFS decreased with crouch angle for all push-off magnitudes, and foot clearance generally did as well

