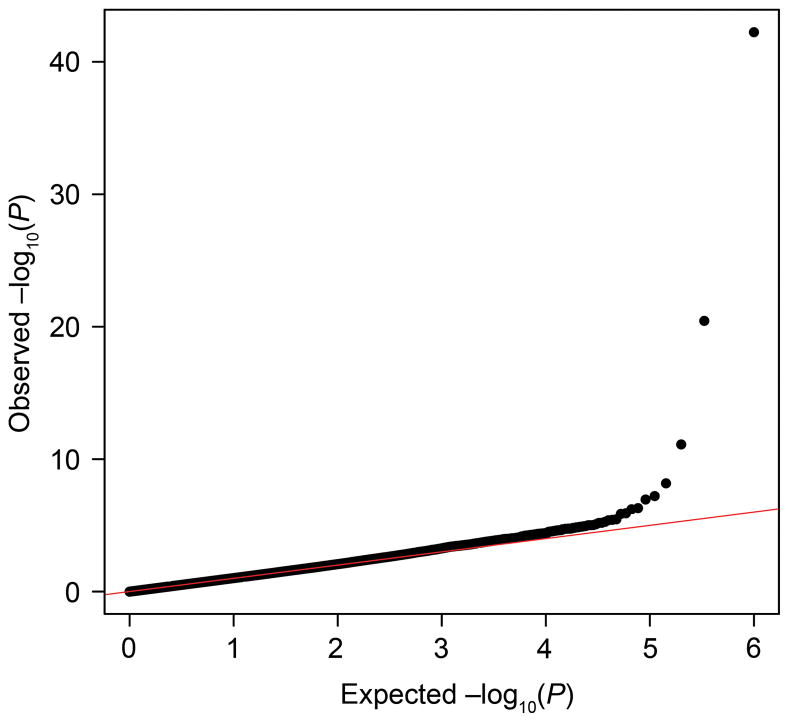
Figure 1.
The quantile–quantile plot for this analysis shows little evidence for inflation of the test statistic because of hidden population substructure, cryptic relatedness, or differential genotype calling between cases and controls. The genomic inflation factor (λGC) for this study was 1.05. The plot was made using association results from Efficient Mixed Model Association eXpedited software.

