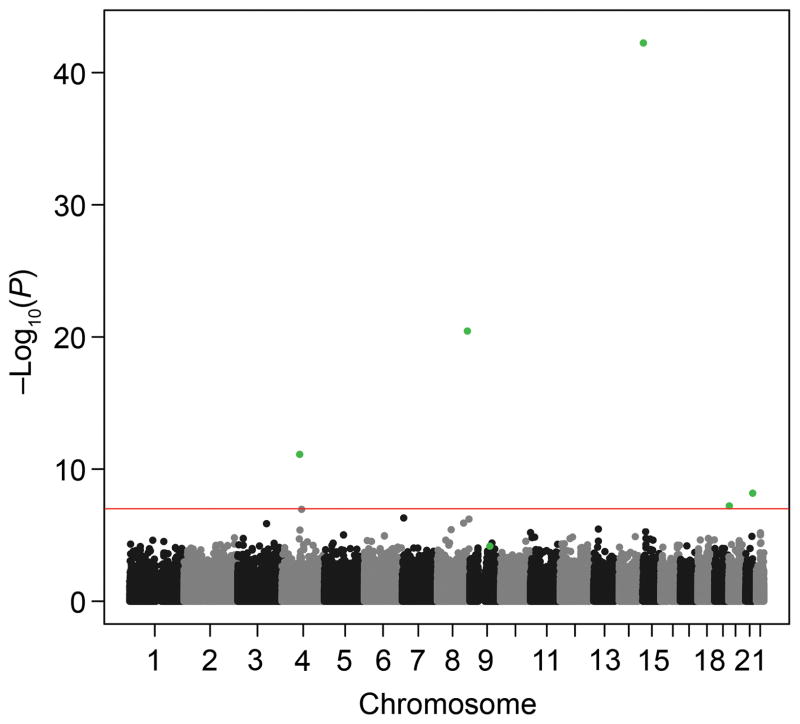
Figure 2.
Genome-wide Manhattan association results for pelvic organ prolapse. P-values are represented as −log (P-value). Results are taken from Efficient Mixed Model Association eXpedited software. The line represents the genome-wide significance threshold of 1×10⁻⁷. The green dots represent the six significant markers in the study.

