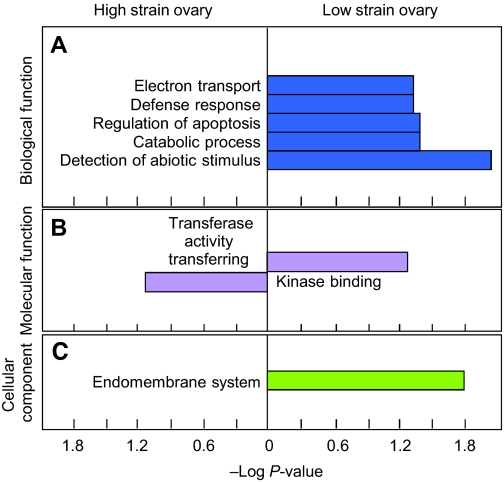
Fig. 1.
Comparison of gene ontology (GO) in the differentially regulated genes between High and Low strains of worker honey bees in terms of (A) biological process, (B) molecular function and (C) cellular component. The x-axis represents –Log P-value (Shamir et al., 2005) and P≤0.05 was used as a cut-off for the statistically enriched category. The corresponding GO term is given beside each horizontal bar. Detailed results for P-values ≤0.10 are given in supplementary material Table S3. Low strain ovaries are typically smaller than High strain ovaries and, interestingly, there was a significant overrepresentation of ‘regulation of apoptosis’ in the Low strain ovaries.

