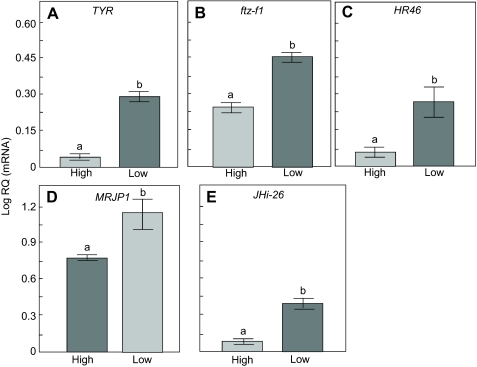
Fig. 3.
Verification of expression differences in candidate genes in High vs Low strain worker honey bees using relative quantification (RQ). The same samples used in the microarray were used for gene expression verification. (A) TYR, a receptor of the neural transmitter tyramine; (B) ftz-f1, an ecdysteroid nuclear receptor; (C) HR46, an ecdysteroid nuclear receptor; (D) MRJP1, a protein component in royal jelly; (E) JHi-26, a JH-inducible gene that can be triggered by methoprene. Bars represent means ± s.e.m.; different letters (a or b) indicate significant differences (one-tailed Student's t-test, P≤0.05). All candidate genes showed a higher expression level in Low strain ovaries than in High strain ovaries, as was the case with the microarray.

