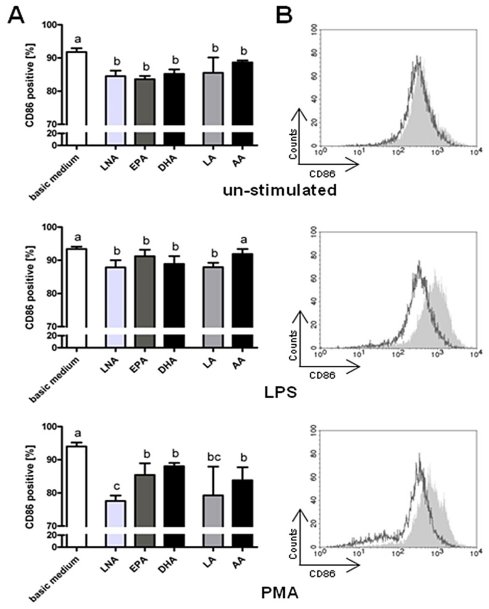
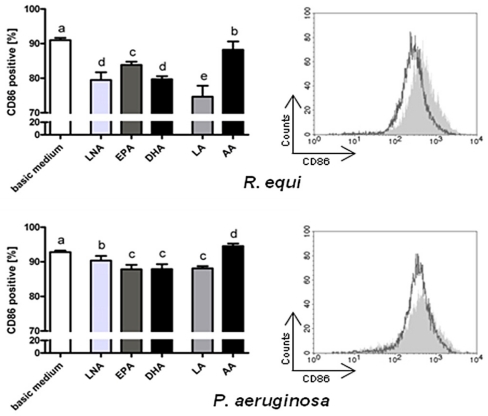
Figure 8.
Expression of the surface molecule CD86 by RAW264.7 macrophages cultured in basic medium as well as in medium supplemented with 15 μmol/L alpha-linolenic acid (LNA), eicosapentaenoic acid (EPA), docosahexaenoic acid (DHA), linoleic acid (LA) or arachidonic acid (AA) after 24 h of stimulation with LPS, PMA, P. aeruginosa ATCC 10145 and R. equi ATCC 33701 respectively. (A) Percentage of CD86 positive cells. Data are mean ± SD (n = 6). Bars denoted by different letters are significantly different; (B) Histograms of surface expression levels of CD86. The grey-shaded histograms correspond to RAW264.7 cultured in basic medium, and empty histograms (dark grey line) correspond to RAW264.7 cultured in LNA supplemented medium. Histograms are representative of one of six experiments.


