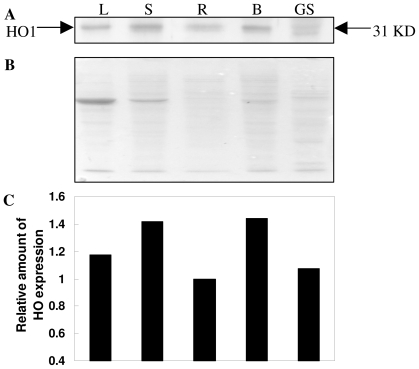
Figure 6.
TaHO1 protein levels in various wheat tissues. Young leaves (L), stems (S), roots (R), and buds (B) were collected from 14-d-old seedlings under the normal growth conditions. Meanwhile, germinating seeds (GS) were sampled after 3 d of germination. Then, TaHO1 protein levels were determined by protein gel blot analysis (A); Meanwhile, Coomassie Brilliant Blue-stained gels (B) were present to show that equal amounts of proteins were loaded. Densitometry was done by Quantity One software to quantify HO-1 protein level (C). Relative HO-1 protein level taking root sample (R) as 100%.

