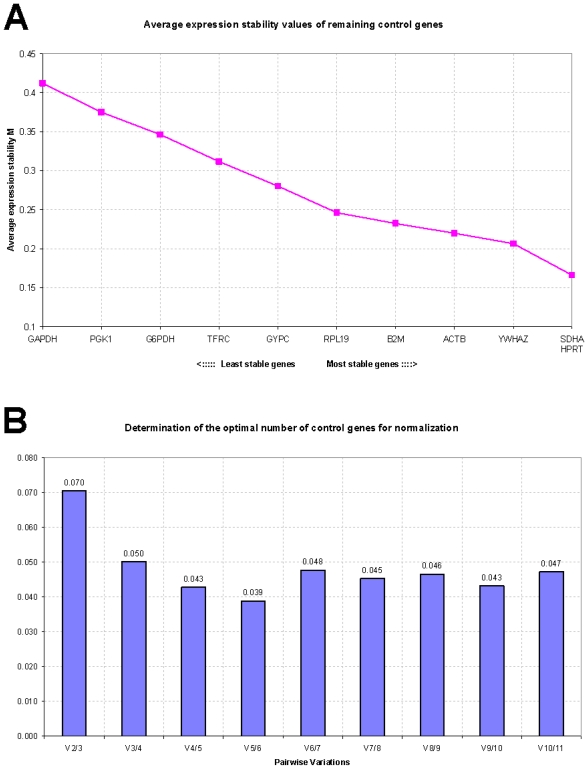
Figure 1.
Gene expression stability analyzed by the geNorm software in control sheep. (A) Average expression stability measure (M) of control genes during stepwise exclusion of genes with relatively higher variable expression among the samples; (B) Determination of the optimal number of control genes for normalization calculated on the basis of the pairwise variation (V) analysis; V values under 0.15 threshold indicate no need to include further reference genes for calculation of a reliable normalization factor.

