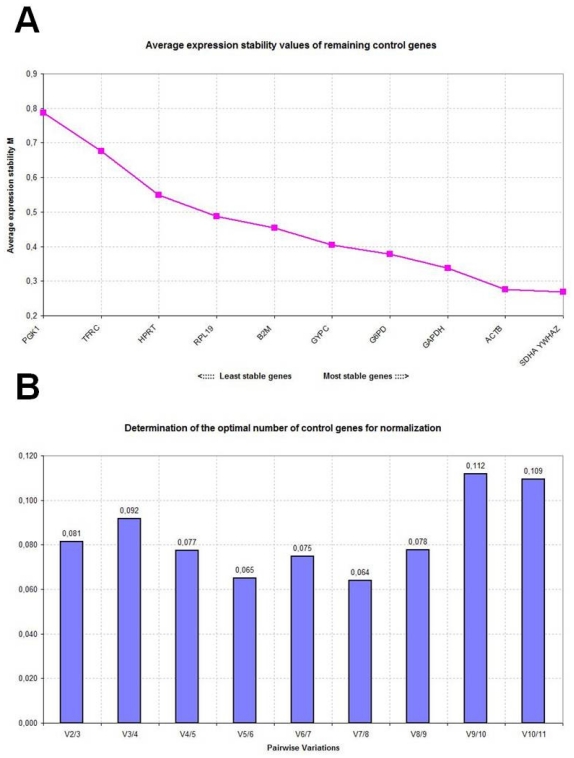
Figure 3.
Gene expression stability analyzed by the geNorm software in combined control and disease-stressed sheep. (A) Average expression stability measure (M) of control genes during stepwise exclusion of genes with relatively higher variable expression among the samples; (B) Determination of the optimal number of control genes for normalization calculated on the basis of the pairwise variation (V) analysis; V values under 0.15 threshold indicate no need to include further reference genes for calculation of a reliable normalization factor.

