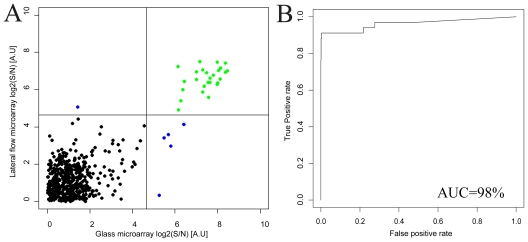
Figure 2.
(A) Lateral flow and glass microarray results from the analysis of 26 antibody samples are compared. Green dots (in the top right quadrant) indicate concordant positive signals, black (bottom left quadrant) are concordant negative signals and blue dots (top left and bottom right quadrants) represent positive signals that only arose on one platform. All expected antibodies were detected by the correct antigen spot on both platforms. The Pearson correlation coefficient for the dataset was 0.74. Only signals higher than the mean for each array are shown; (B) A receiver-operator-characteristics analysis was performed, employing the vertical threshold for the glass array signals indicated in (A). The area under the curve (AUC) was found to be 98%, suggesting a very good binary classification concordance between the methods.

