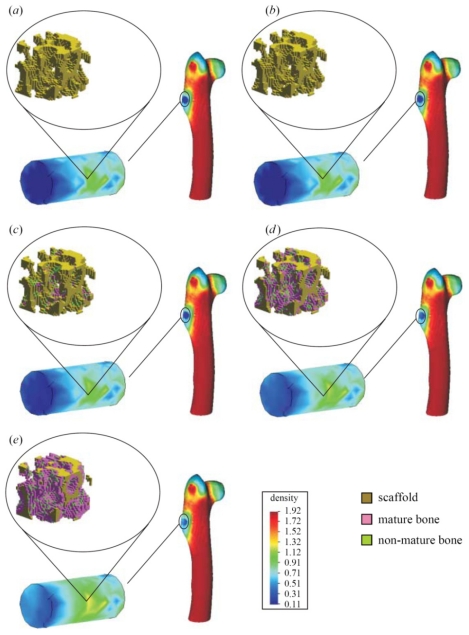
Figure 8.
Apparent density evolution (g·cm−3) of a proximal femur implanted with a scaffold in the greater trochanter region. In each part, the bone organ (right), detail of the scaffold implantation (bottom left) and the bone regeneration distribution onto the scaffold microsurface of the macroscopic scaffold midpoint (top left) are shown: (A) 2 days; (B) 14 days; (C) 28 days; (D) 42 days; and (E) 56 days after implantation. From [139].

