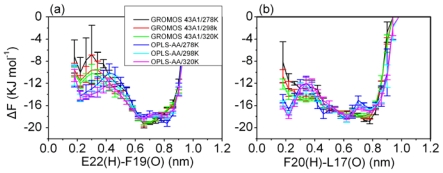
Figure 5.
The free energy profiles were calculated as a function of the distance between the hydrogen and oxygen atom involved in the β-turn. The profiles were plotted as the distance between (a) E22 (H) and F19 (O); (b) F20 (H) and L17 (O). Error bars correspond to a standard deviation of the corresponding property as being obtained by considering four subsets of the simulation.

