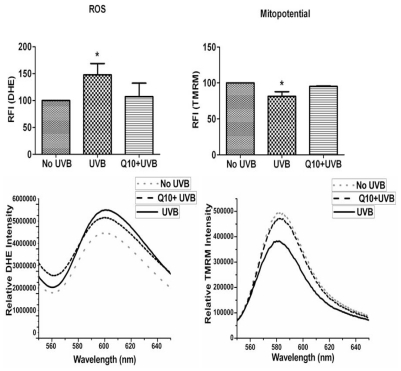
Figure 3.
Measurements of ROS production by DHE (left column) and mitochondrial membrane potential by TMRM (right column). ROS bar graph demonstrates increases in ROS production after UVB and the anti-oxidative effect of CoQ10. Mitopotential bar graphs show mitochondrial membrane potential depolarization after UVB and preventive effect of CoQ10. Lower panels are representative original recordings. Data are collected form 3 independent experiments and presented as means ± s.d. * p < 0.05 against control. One-way ANOVA followed by Tukey’s test.

