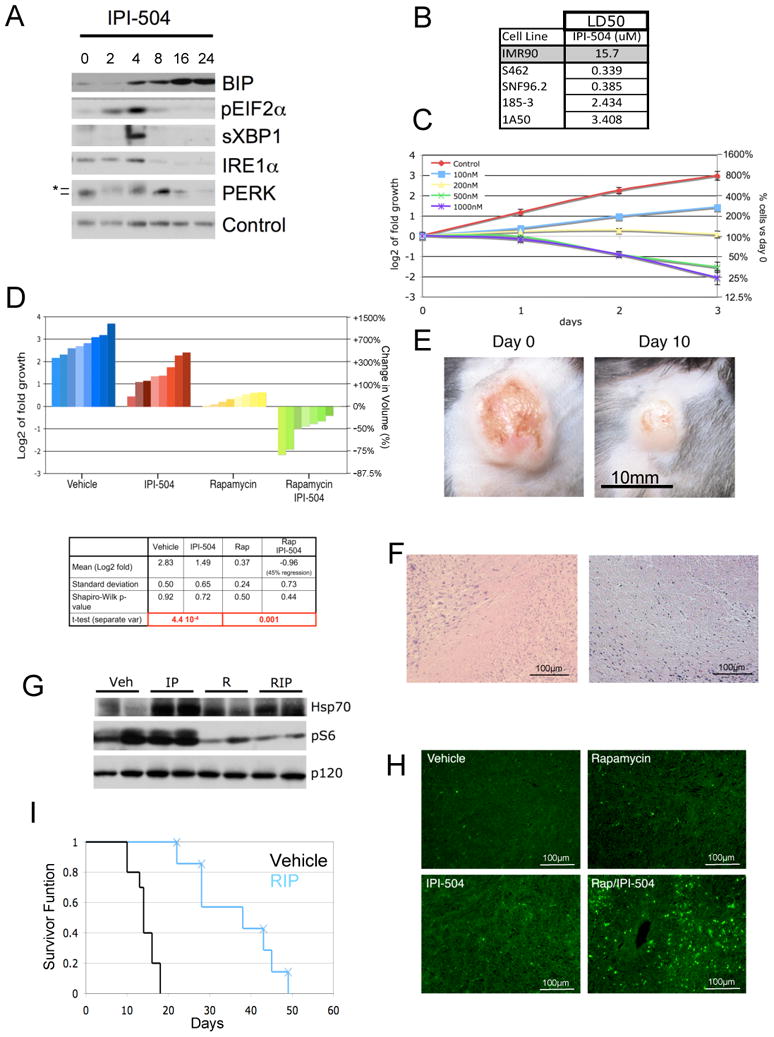
Figure 2. Rapamycin and IPI-504 promote MPNST regression.

(A) Immunoblots of BIP, pEIF2α, sXBP-1, IRE1α and PERK in human MPNSTs treated with IPI-504 over time (hours). Note that the activation of pEIF2α, sXBP1, IRE1 and PERK (*denotes activated phosphorylated PERK) and initial upregualtion of BIP occurs within 2-4 hours. A second wave of BIP upregulation occurs between 8-16 hours, as pEIF2α, sXBP-1, IRE1α and PERK become suppressed. Actin serves as a loading control. (B) LD50 values in response to IPI-504 (72 hours) for normal cells (IMR90), human MPNST cell lines (S462, SNF96.2) and mouse MPNST cell lines (185-3, 1A50). (C) Growth curves of the S462 cell line treated with different concentrations of IPI-504. (D) Waterfall plot depicting tumor growth after 10 days of treatment with vehicle (blue), IPI-504 (red), rapamycin (yellow) and rapamycin/IPI-504(green). The left y-axis indicates the log2 of tumor fold growth vs. day 0 and the right y-axis shows the change in fold volume. The table reports mean and standard deviation for each treatment arm (n=8) and mean tumor shrinkage. The Shapiro-Wilk test shows that all data sets have a normal distribution. (E) A photograph of an MPNST is shown at day 0 and after 10 days of treatment with Rapamycin/IPI-504. (F) H&E stained tumors from animals treated with rapamycin/IPI-504. (G) Pharmacodynamic analysis of lung tissue after 16h of treatment as shown by an Hsp70 and phosphoS6 immunoblots. p120 serves as a loading control. (H) TUNEL staining of tumors treated for 16h. (I) Kaplain-Meier curve of tumor bearing Nf1/p53 mutant mice treated with vehicle (black) or rapamycin (blue) as described. X's indicate and animal that was euthanized due to skin ulceration. All error bars show +/− SD. (See also Figure S2)
