
Figure 5. Oxidative stress plays a critical role in mediating the therapeutic response to IPI-504 and rapamycin.
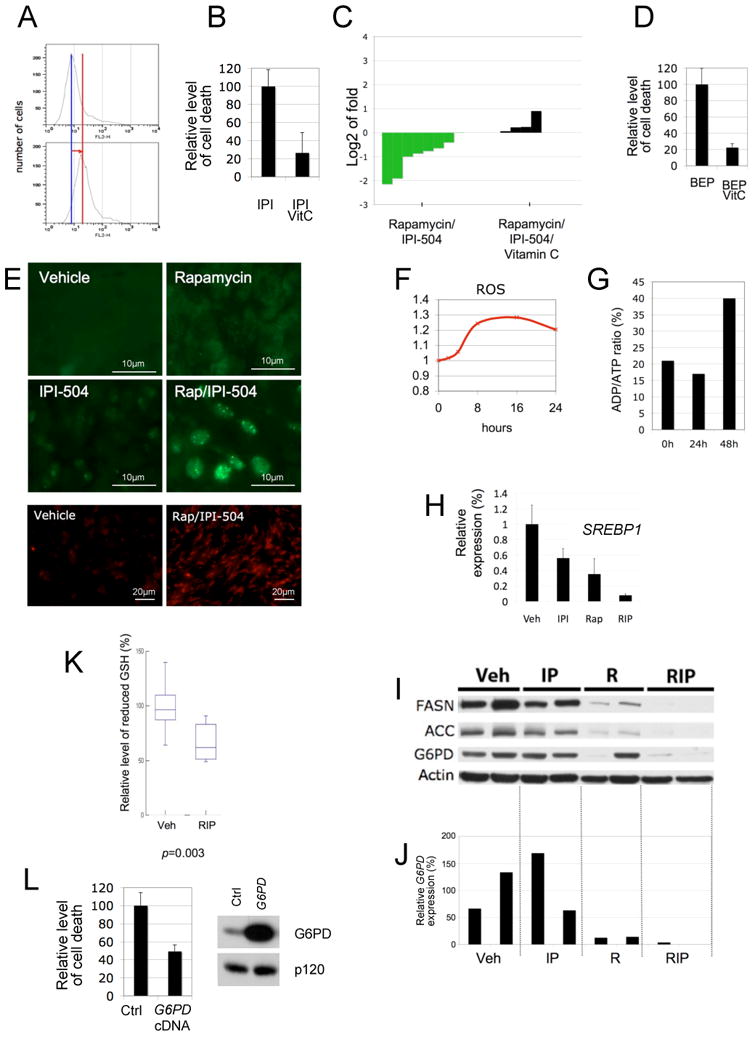
(A) Levels of ROS induced by IPI-504 in MPNST cell lines in vitro. The red line depicts the shift in fluorescence intensity, reflecting ROS production. (B) Relative levels of cell death in the presence of 500nM IPI-504 +/− 100uM Vitamin C. (C) Waterfall plot depicting tumor growth after 10 days of treatment with rapamycin/IPI-504 as shown in Figure 2 (green) versus rapamycin/IPI-504 and Vitamin C (black). The left y-axis indicates the log2 of tumor fold growth vs. day 0. (D) Relative levels of cell death in response to 500nM BEP800 +/− 100uM Vitamin C. (E) (Top 4 panels) Immunocytochemistry using a PML antibody (green) on tumors treated for 7 hours as indicated. (Bottom 2 panels) Dihydroethidium staining (red) of frozen MPNST tumor tissue depicting an increase in ROS levels in response to Rap/IPI-504 after 7 hours of treatment. (F) Kinetics of ROS induction in S462 cells in response to IPI-504/Rap. (G) Kinetics of the ratio of ADP/ATP in S462 cells in response to IPI-504/Rap. Note that ROS production precedes the increase in ADP/ATP levels (decrease in ATP). (H) SREBP1 mRNA levels in tumors from animals that were treated for 7 hours as indicated. (I) Immunoblots showing expression of FASN, ACC and G6PD in tumors from animals treated for 7h as indicated. Actin serves as a loading control. (J) G6PD mRNA levels in individual tumors treated as described in i. (K) Relative levels of reduced glutathione (GSH) in tumors treated with vehicle or rapamycin/IPI-504 (n-6). (L) Relative levels of cell death caused by IPI-504 in cells ectopically expressing G6PD or a GFP control plasmid. Immunblot demonstrating G6PD protein levels in MPNSTs used in the left panel. (See also Figure S5)