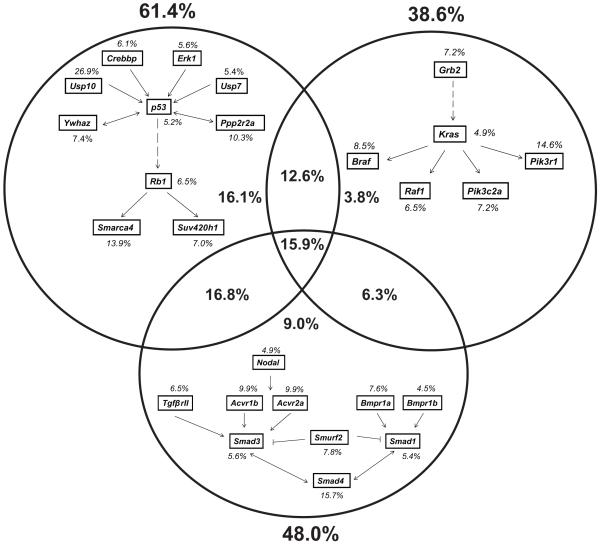
Figure 2. Comparison of Sleeping Beauty insertions in K-Ras, p53 and TGFβ signaling pathways.
CIS genes immediately upstream or downstream of K-Ras, p53 or Smad4 were identified and analyzed for the occurrence of transposon insertions. Percentages of tumors with insertions in genes are indicated in italics. Percentages in bold show the overall proportion of tumors with insertions in each pathway.

