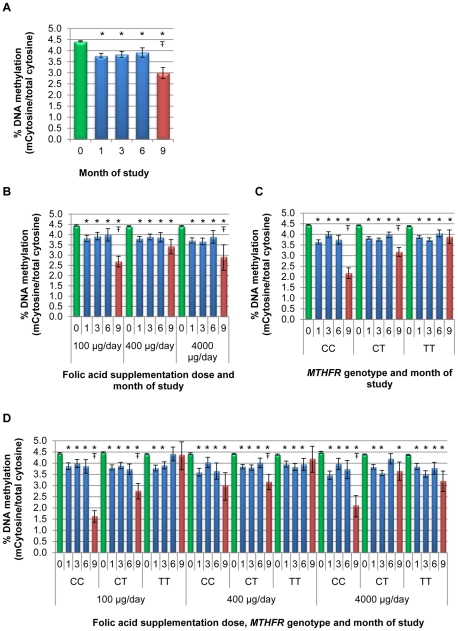
Figure 2. Global DNA methylation changes in response to folic acid supplementation and withdrawal among women of reproductive age- Coagulated Blood.
Enrollment % DNA methylation (%MdCyt/total cytosine) is shown in green, DNA methylation level during the supplementation trial is shown in blue and DNA methylation level after the discontinuation of supplementation (withdrawal) is shown in red. A. Overall estimated mean %MdCyt and 95% Confidence Intervals (CI) were generated from a general linear model of repeated measure model (GLMRM) containing; folic acid dose, MTHFR genotype, age, BMI, enrollment RBC and time (0,1,3,6,9 months data) weighted to adjust for sampling. The model showed a significant interaction of folic acid dose and MTHFR genotype (P<0.001). B. Estimated mean %MdCyt and 95% CI were generated from a GLMRM stratified by folic acid dose; adjusting for MTHFR genotype age, BMI, enrollment RBC and time and weighted to adjust for sampling. C. Estimated mean %MdCyt and 95% CI were generated from a GLMRM stratified by MTHFR genotype; adjusting for folic acid dose, age, BMI, enrollment RBC and time and weighted to adjust for sampling. D. Estimated mean %MdCyt and 95% CI were generated from a GLMRM stratified by MTHFR genotype and folic acid dose; adjusting for age, BMI, enrollment RBC and time and weighted to adjust for sampling. * Significant difference compared to enrollment p<0.01 –Ŧ Significant difference between the DNA methylation level at the end of the supplementation trial (6 months) and after the discontinuation of supplementation (9 months) p<0.01.

