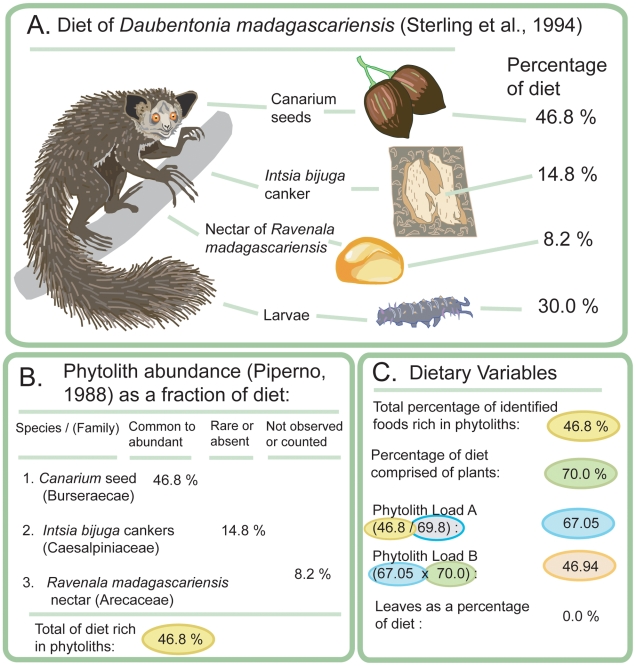
Figure 1. Steps in development of variables from raw data obtained from one dietary study [53].
(The aye-aye is modified, with permission, from an illustration by Stephen D. Nash). Panel A: Percentage of feeding time spent on each food consumed by Daubentonia madagascariensis in direct observations taken from one dietary study. Panel B: The phytolith abundance of each of the plant foods is determined by categories developed by Piperno [33], summarizing research of phytolith abundance in plants. Only the dietary percentage of plants categorized as “common to abundant” in phytoliths was totaled. In this study, the total percentage of feeding time spent on identified plant foods rich in phytoliths is 46.8. Panel C: How the three variables in this study were obtained. The total percentage of identified foods rich in phytoliths, as shown in Panel B, is 46.8. The percentage of the diet comprised of plants is 70.0. The percentage of identified plant foods is 69.8. Phytolith Load A is calculated as the percentage of identified foods rich in phytoliths (46.8) divided by the percentage of identified plant foods (69.8), or 67.05%. Phytolith Load B is calculated by multiplying Phytolith Load A by the percentage of the diet made of plants: 67.05×70.0 = 46.94%. The third variable consists of leaves as a percentage of the total diet.

