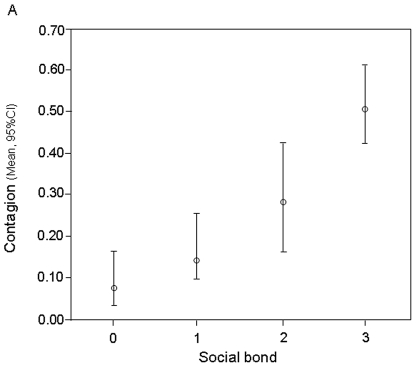
Figure 1. Contagion occurrence as a function of social bond.
Model-estimated value of contagion (marginal means, Y axis), for each value of the main effect (social bond, X axis). Bars show the 95% upper confidence interval (95% CI) for the marginal means. GLMM (AICc = 2272.933; n = 480). Social bond categories: 0 = strangers; 1 = acquaintances; 2 = friends; 3 = kin with r≥0.25 and life partners).

