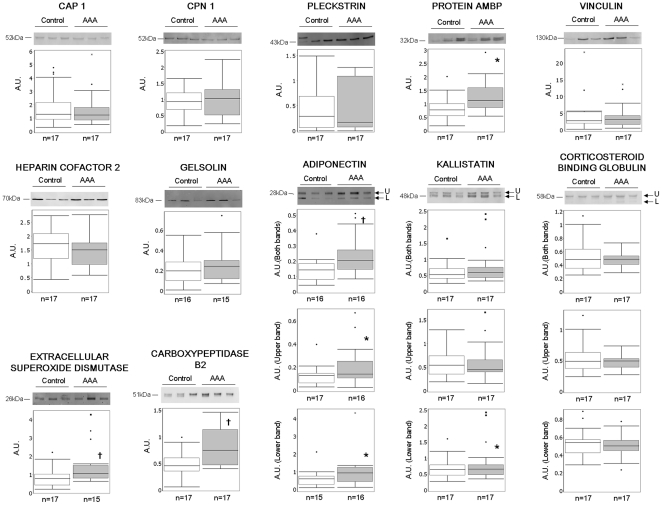
Figure 2. Proteins abundance in individual plasma samples from AAA and control patients.
Data of all patients tested is represented in a box plot but only Western blot of three representative samples of each group are presented. The position of Mr value for each protein is indicated. * p<0.05; † p<0.01. n = number of patients in each group; A.U.: arbitrary units; U: upper; L: lower.

