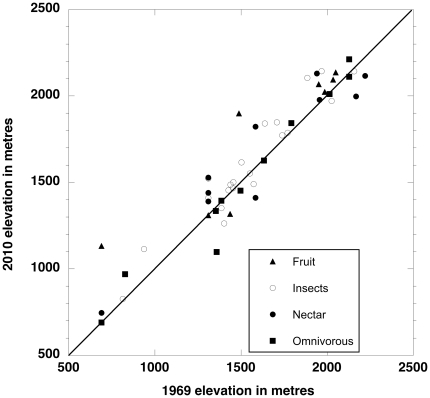
Figure 2. Elevational range shifts.
Weighted mean elevation (m) for each bird species in 1969 and in 2010, minus elevation changes expected by chance from uneven sampling effort. Each dot (species) is coded according to its diet. The diagonal line is the x = y lines, points along this line indicate no change between the two time periods. N = 55.

