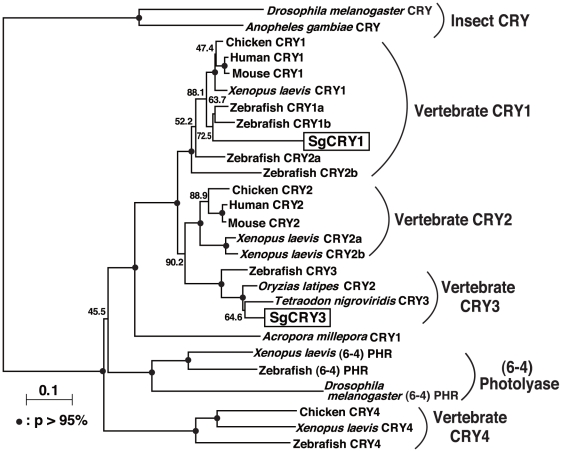
Figure 1. Phylogenetic tree of CRY family proteins.
Goldlined spinefoot CRY sequences (SgCRY1 and SgCRY3; present study) and their related sequences obtained from NCBI Entrez database (accession nos. are shown in Table S1) were analyzed using the Neighbor-Joining method [44] and CLUSTAL W (http://clustalw.ddbj.nig.ac.jp/top-e.html). Bootstrap probabilities (p) are represented by closed circles on the nodes (p>95%) or values near the nodes.

