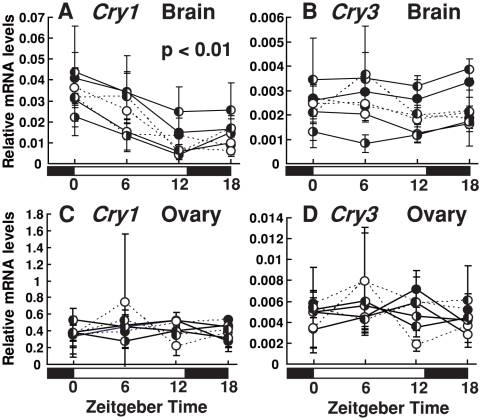
Figure 3. SgCry mRNA levels and their daily variation in the brain and ovary.
Each tissue (brain [mesencephalon and diencephalon]: n = 4, ovary: n = 3) was collected at ZT0, ZT6, ZT12, ZT18 from new moon to full moon over one and half lunar cycle. Each Cry mRNA level was calculated as a value relative to that of the Sgβ-actin gene. Error bars represent ± SD. Lunar phases are indicated by schematic moon images. Solid lines show the first lunar cycle, and broken lines show second lunar cycle. (A) Daily changes in the SgCry1 mRNA levels in the brain. p<0.01, Two-way ANOVA. (B) Daily changes in the SgCry3 mRNA levels in the brain. (C, D) Daily changes in the SgCry1 and SgCry3 mRNA levels in the ovary. The graphs are separated into single panels for each lunar phase in Figure S1.

