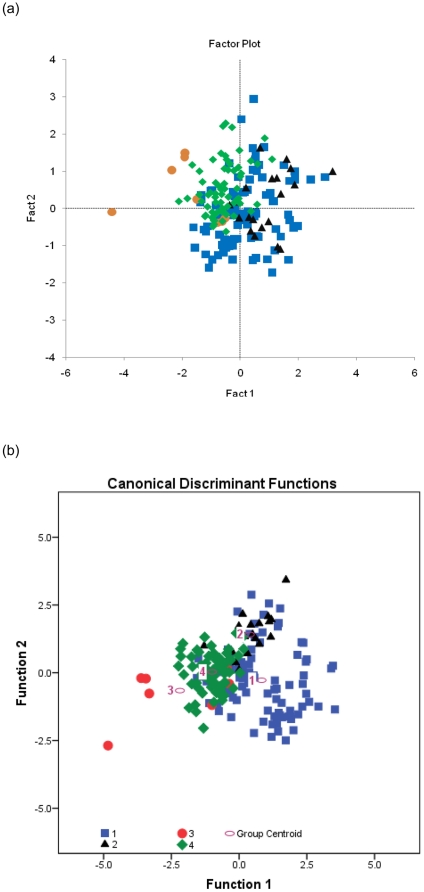
Figure 2. Multivariate analyses of four wing elements for 183 species (S1).
(a) Principal component analysis (PCA) showed by (PC) 1 and 2. hu (0.897) and ul (0.822) have high and positive loadings on PC1,which exlplains 56% variance; f prim has a high negative loading (−0.790) on PC1, which explains 32% variance; On PC 2, mn length has a high negative loading (−0.905); (b) Discriminant function analysis (DFA) represented by DFA functions 1 and 2. Function 1 is most strongly correlated with hu (−0.887) and f prim (0.754) length and explains 76.3% variance; Function 2 explains 22.9% variance and is most strongly correlated with ul length (0.913). 1, ‘continuous flapping’; 2, ‘flapping and soaring’; 3, ‘flapping and gliding’; 4, ‘passerine-type flight’.

