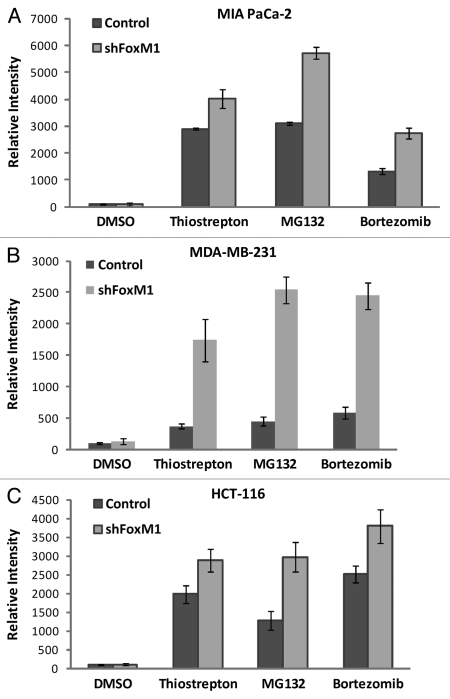
Figure 2.
FoxM1 knockdown cells undergo stronger apoptosis induced by PIs. Densitometry was performed on scanned immunoblot images using the ImageJ gel analysis tool. The gel analysis tool was used to obtain the absolute intensity (AI) for each experimental cleaved caspase-3 band for control and shFoxM1-k/d pancreatic (A) MIA Paca-2, breast (B) MDA-MB-231 and colon (C) HCT-116 cancer cells. Relative intensity (RI) for each experimental band was calculated by normalizing the experimental AI to the corresponding loading control β-actin AI. Columns, mean of three separate experiments; bars, SD.

