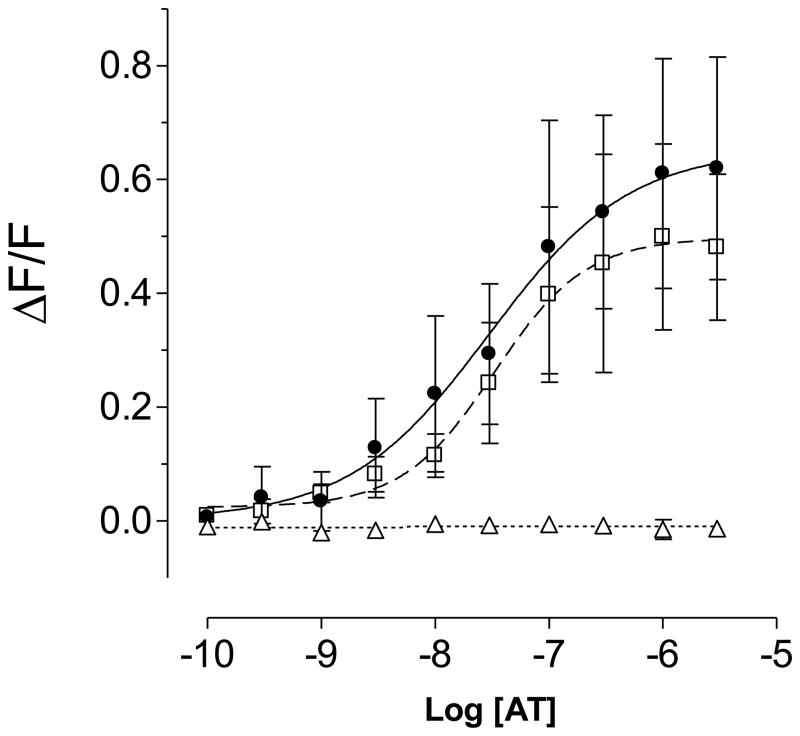
Fig. 3. Functional characterization of the AT receptors by FLIPR experiments.
Dose–response curves of the effects of AT on the intracellular calcium concentration in cells expressing ATrM2 (filled circles), ATrM3 (open squares) and ATrM1 (open triangles). Vertical scale: ΔF/F ratio; horizontal scale: logarithmic concentration of AT. Data represent the means ± SEM of three independent experiments.

