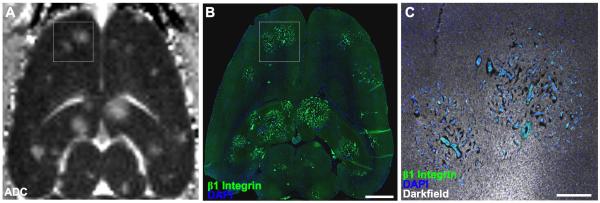
Figure 4. MRI underestimates co-opted tumor number and extent.
An ADC map (A) and a slice-matched histological section (B) are shown. The histological section demonstrated a greater number of micrometastases and a larger extent of infiltrating lesions than were seen on the ADC map. ADC is sensitive to edema shown histologically as increased extracellular space adjacent to infiltrating tumor cells (C). Scale bars indicate 2 mm in B and 500 μm in C.

