
Figure 6. Differential growth kinetics of metastases situated in the brain or bone.
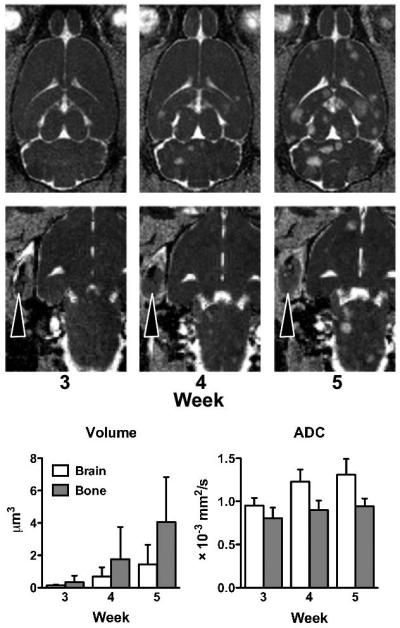
Brain metastases, depicted on ADC maps, increase in both size and the number from weeks 3 to 5 post-injection. The MRI-defined tumor margins expanded at a greater rate in bone metastases than in brain metastases. The ADC of bone metastases remained stable over the course of disease, but the ADC of brain metastases continued to increase over time.