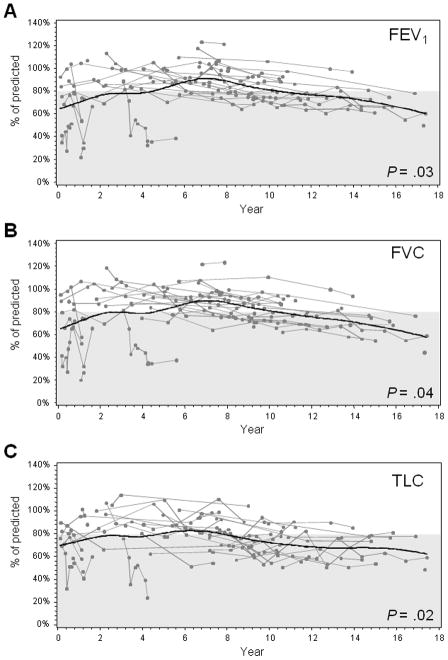
Figure 1.
Longitudinal changes in pulmonary function tests after whole lung irradiation. During follow-up, the patients’ FEV1 (A), FVC (B), and TLC (C) values were measured and compared to values predicted by measurements in the control population. Each line plotted represents the percent of the predicted test value that was measured from an individual patient at the time of each PFT. A smooth line was fitted to the data by using a spline-interpolation method for each response variable along the year after whole lung irradiation. The gray shaded area indicates the range of abnormal test values.

