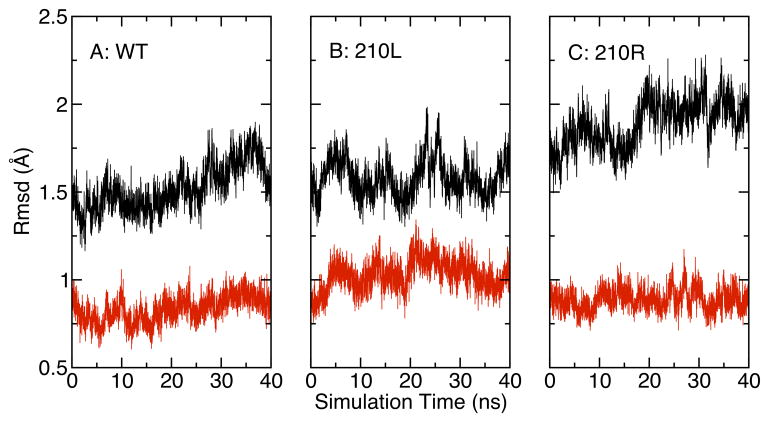
Figure 3.
OmpLA CA RMSD variation as a function of simulation time. The reference protein was the X-ray crystal structure 1QD5. (A) Wild type protein, (B) 210L substituted protein, (C) 210R substituted protein. RMSD values for the entire protein including water-soluble loops are shown in black; RMSD values for transmembrane β-barrel residues alone are shown in red.

