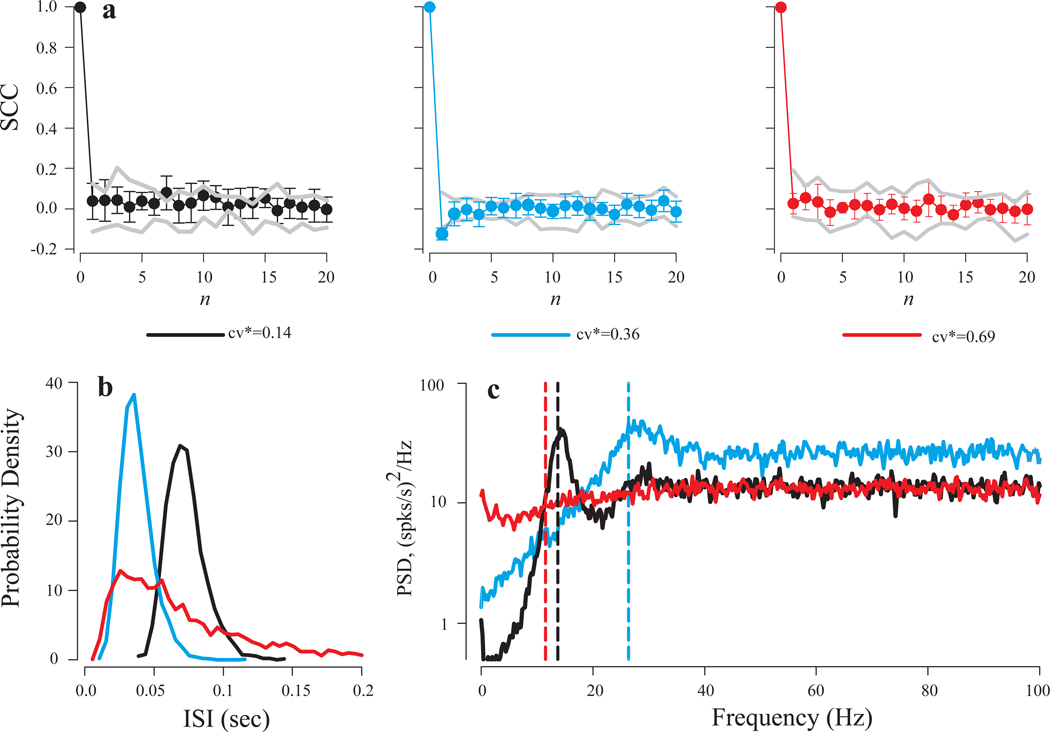
Fig. 1.
Analysis of spontaneous discharge regularity of three PC afferents with cv* values of 0.69 (red lines), 0.36 (blue lines), and 0.14 (black lines). (a) Serial correlation coefficients (SCC) as a function of the number of intervening intervals (n). Gray lines show minimal and maximal values of SCCs for shuffled ISIs. Only the unit with cv*=0.36 showed significant serial correlation coefficient for n=1. (b) ISI distributions. (c) Power spectra. Afferents with lower cv* values showed clear peaks at the frequencies close to their mean firing rates (vertical dashed lines) and drop off sharply below the mean firing rate, indicating less intrinsic noise at the lower frequencies.

