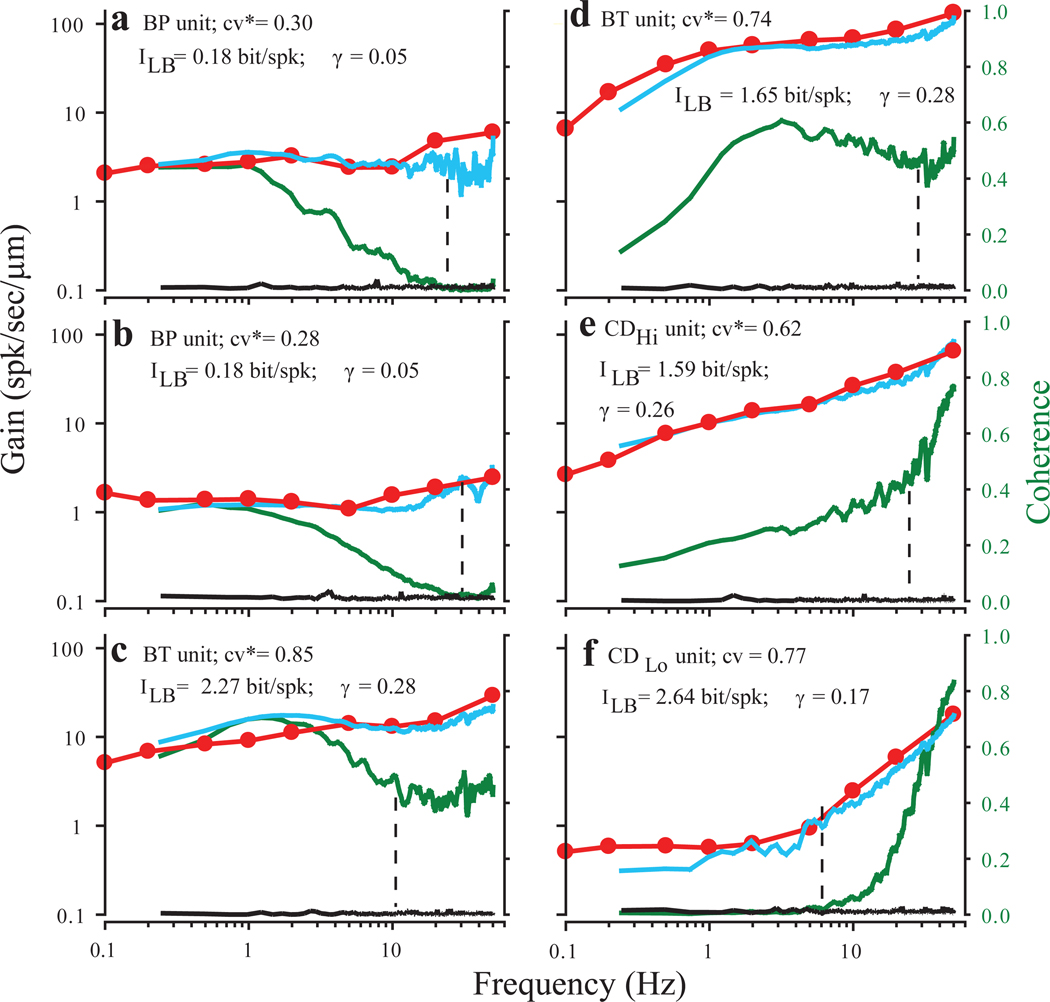
Fig. 3.
Comparison of linear gains and coherence functions for 6 PC afferents. All afferents were stimulated with Gaussian noise band limited to 50 Hz. In each panel (a–f), gain calculated from responses to Gaussian noise are shown in blue, gain for the same afferent measured from responses to sinusoidal indentation in red, and coherence between the Gaussian stimulus and the afferent response in green. Note that coherence axis is linear. The black lines are coherence values from the same data sets, but calculated after randomly shuffling all the ISIs in the response, preserving ISI distributions, but eliminating any higher order structure. They provide an estimate of coherence values that would be obtained by chance for any particular data set. Mean spontaneous firing rates are indicated by vertical dashed lines. All units were identified on the basis of responses to efferent stimulation. For each unit cv*, lower bound information estimate (ILB), and coding fraction (γ) are also shown. Peak-to-peak sinusoidal indenter amplitudes and Gaussian noise SD, respectively, were (in µm) 3.5 and 2.07 in a, 16.7 and 4.64 in b, 7 and 2.1 in c, 1.5 and 0.5 in d, 3.5 and 1.03 in e, and 16 and 4.6 in f.

