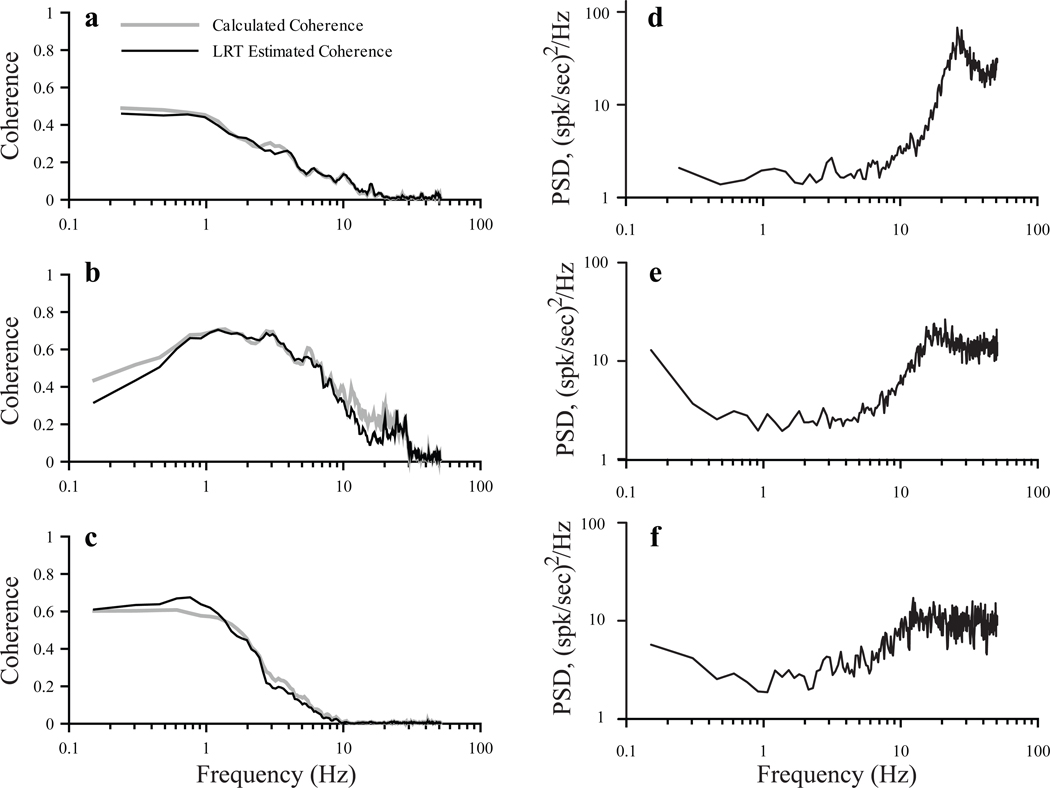
Fig. 4.
Comparison of calculated coherence functions (A–C, grey lines) with those estimated based on linear response theory (a–c, black lines) and spontaneous power spectra (D–F) for 3 afferents with cv* values of 0.3 (a,d), 0.32 (b,e) and 0.335 (c,f). Calculated SR coherence in A is re-plotted from Figure 3A. Units were stimulated with Gaussian noise band limited to 50 Hz (a), 30 Hz (b) and 10 Hz (c). Intensities (Gaussian SD) were 2.07 (a), 6.47 (b), and 6.63 (c).

