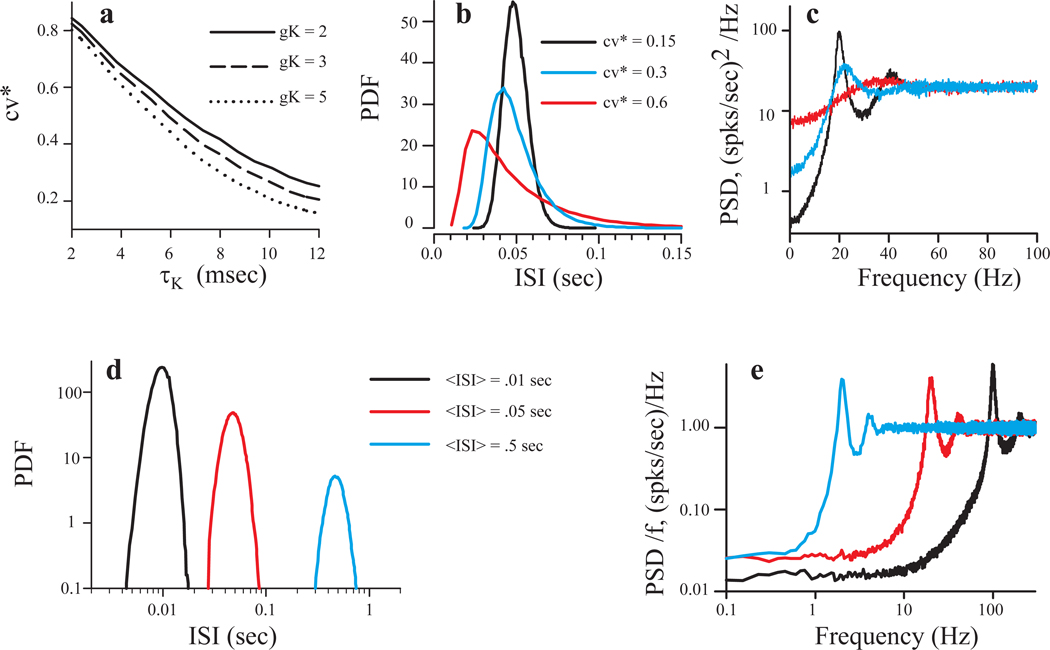
Fig. 8.
Spontaneous dynamics of the model. In panels a – c, the AHP time constant, τK was varied while the mean firing rate was fixed at 20 spikes/s by tuning the threshold voltage VT, keeping other parameters constant. a: cv* versus AHP time constant for indicated values of AHP strength (gK). b: Probability density of spontaneous ISIs for indicated values of cv*. c: Power spectral density (PSD) of spontaneous discharges for the units in panel B. Panels d and e, illustrate the ISI probability density and spontaneous discharge PSD for three different mean firing rates at a fixed cv value of 0.165. The PSD values in E were normalized to the mean firing rate.

