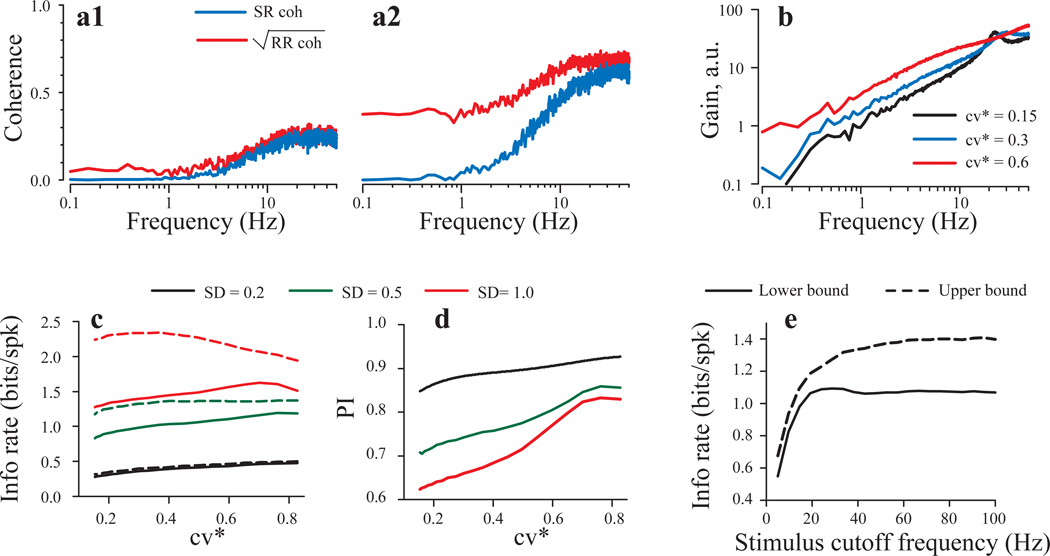
Fig. 9.
Model results for stimulation with Gaussian noise band limited to 50 Hz. Model parameters are shown in Table 1. In all simulations, the mean spontaneous firing rate was fixed at 20 spikes/s. a: SR coherence (blue lines) and the square root of RR coherence (red lines) for a model unit with cv = 0.6, for two values of stimulus strength; SD =0.3 (A1) and SD = 1 (A2). b: Gain for the 50 Hz band limited noise with the strength SD = 0.5 and three values of cv (a.u. stands for arbitrary units). c: lower bound (solid lines) and upper bound (dashed lines) estimates of mutual information rates versus cv for the three values of stimulus intensity. d: performance index PI versus cv for the same data as in panel b. e: lower bound (solid lines) and upper bound (dashed lines) estimates of mutual information rates versus the cutoff frequency for a model unit with cv = 0.5 (stimulus intensity, SD = 0.5).

