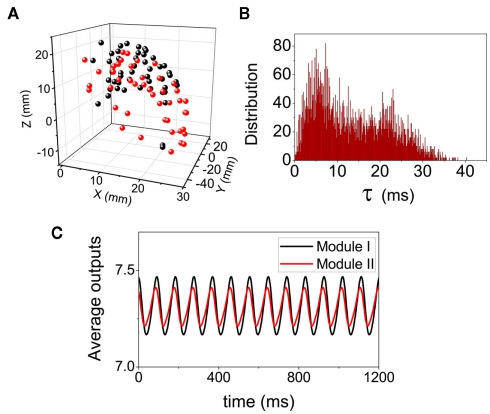
Figure 9.
Dynamical pattern on the cortical network of Macaque visual system. (A) The spatial positions of the network nodes. (B) The distributions of the delay time τ when the conduction velocity is set as a biological reasonable value 2.4 mm/ms. (C) The average values of the output within each modules.

