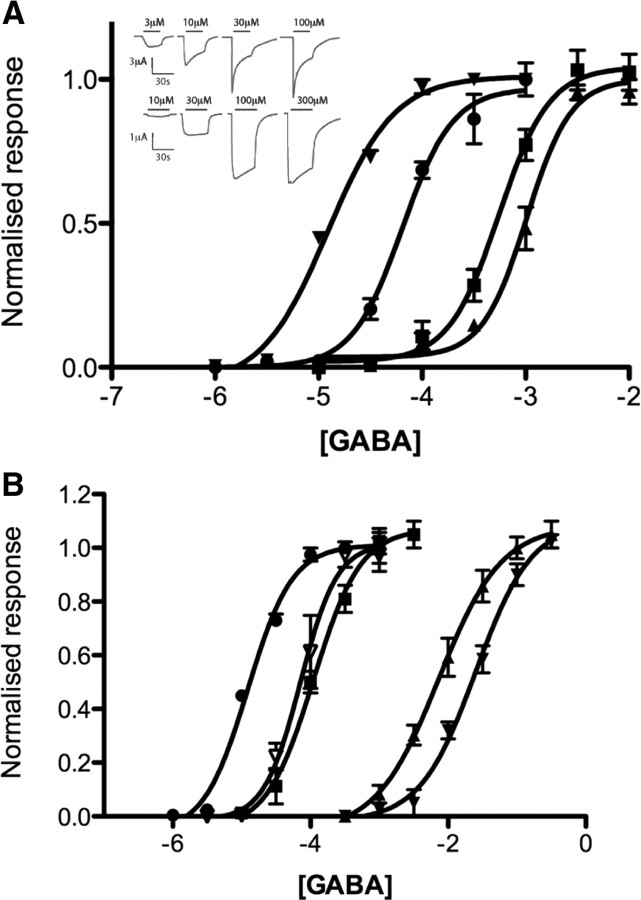
Figure 2.
GABA concentration response curves responses. A, GABA-induced current dose–response curves showing incremental increases in EC50 when RDL F206TAG mRNA was coinjected with Phe (▾), F-Phe (●), F2-Phe (■), and F3-Phe (▴) tRNA. Inset, Typical responses to a range of GABA concentrations in WT (upper) and FPhe-containing (lower) receptors. B, GABA-induced current dose–response curves showing incremental increases in EC50 when RDL Y254TAG mRNA was coinjected with Phe ▿, F-Phe ■, F2-Phe ▴, and F3-Phe ▾ tRNA. ●, WT.

