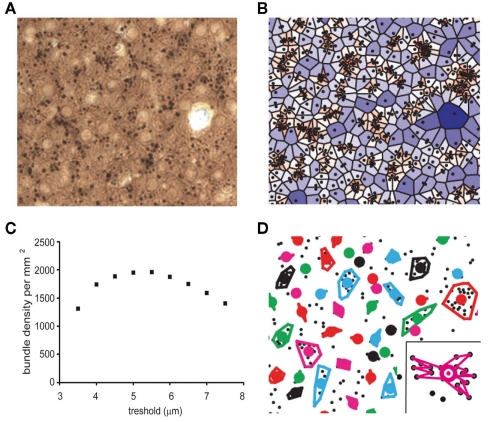
Figure 1.
Quantitative analysis of dendritic bundles in the mouse somatosensory cortex. (A) Typical example of a MAP-2 immunostained tangential section showing clusters of ascending apical dendrites of pyramidal neurons (black dots). (B) Surface polygons as determined by the Voronoi tessellation (borders excluded), are marked by a color scale that indicates surface. Values range from small (red) to large (blue). (C) The mean dendritic bundle density per mm2 in layer 3 of the somatosensory cortex of wildtype mice remains similar when the nearest neighbor distance threshold varies from 4.5 to 6 μm. (D) Using a nearest neighbor distance threshold of 5.5 μm and a minimum of three dendrites per bundle, bundles are now determined and bundle surface can be calculated in two different ways: (1) as the surface of the polygon with the smallest circumference that includes all dendrites (as shown in figure) or (2) as the surface of the polygon that connects all dendrites continuously (see inset). Colored circles represent the location of the bundles (see Materials and Methods).

