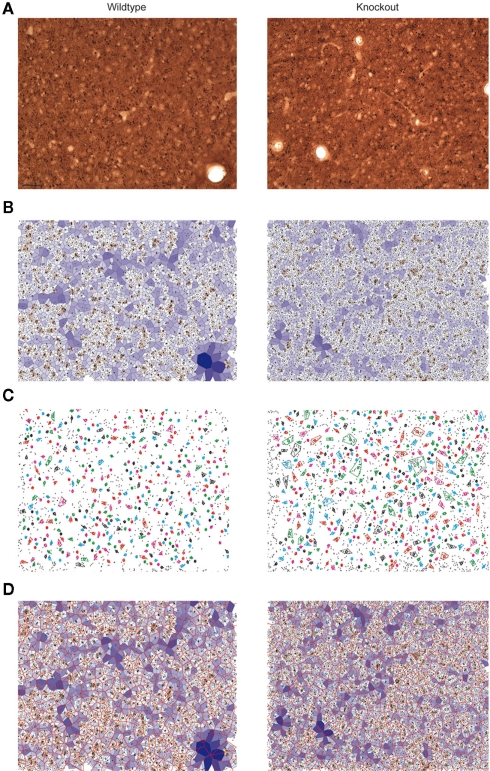
Figure 3.
Quantitative analysis of dendritic bundles in the mouse somatosensory cortex of wildtype (left) and 5-HT3A receptor knockout mice (right). Typical examples of (A) MAP-2 immunostained tangential sections show clusters of ascending apical dendrites of pyramidal neurons (seen from above as small black circles). (B) The polygons obtained using the Voronoi tessellation where the surface associated with each dendrite is indicated with a color scale from small (red) to large (blue). (C) Dendritic bundles as defined using a nearest neighbor threshold of 5.5 μm and a minimum of three dendrites in a bundle. Colored circles indicate the center of the bundles, drawn colored polygon indicates the outer circumference of the bundle and thus its size (D) Bundle polygons (red honeycomb structure) superimposed on the dendrite polygons. Scale bar 50 μm.

