
Figure 1.
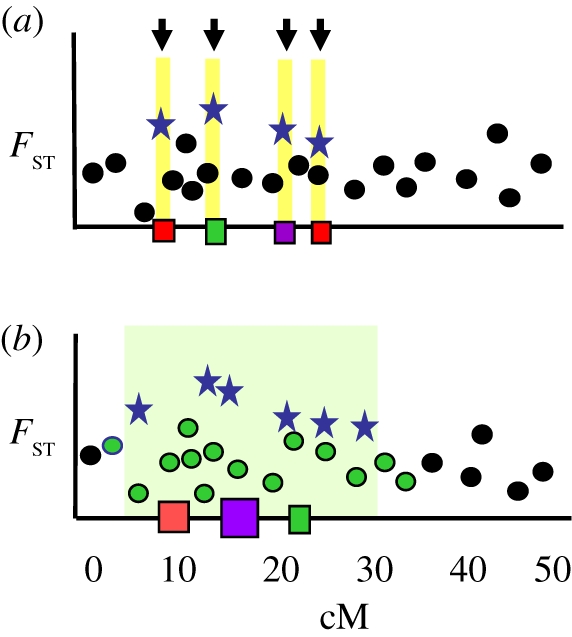
Alternate interpretations of outliers. (a) In the conventional view, each outlier marks an individual candidate gene under migration/selection balance (arrowed yellow bars). Between candidate gene regions, low FST markers are assumed to experience gene exchange. (b) A region of divergence hitchhiking (DH; green shading) around a cluster of divergently selected QTL is recognized by the associated cluster of FST outliers. Low FST markers within DH regions are assumed to be protected from gene exchange. Red, green and purple squares, QTLs for different traits; blue star, class1; green circle, class2; black circle, class 3.