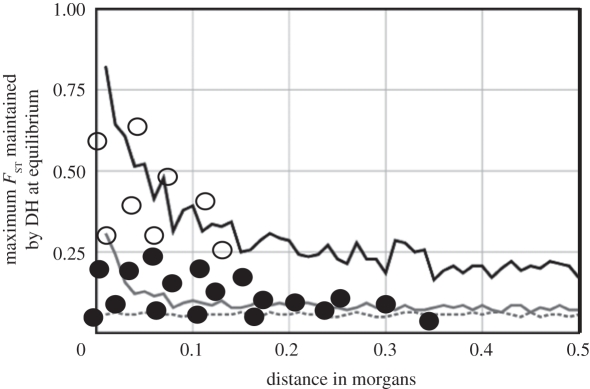
Figure 2.
Relationship between the maximum FST that can be maintained by DH at equilibrium and the map distance from a selected gene, for two intensities of divergent selection (modified from [27], for a population with Ne = 1000 and m = 0.001). Hypothetical FST estimates for different markers in a genome scan are overlaid; open circles are FST outliers, filled circles are non-outliers. Although the curves in this figure are often thought to illustrate the predicted FST values under DH, many markers will have lower FST than predicted if the sampled populations are not at equilibrium. This is illustrated here by the mixture of FST outliers and non-outliers near the selected gene. If the selected gene is not at the end of the chromosome, the curves and estimated FST values would be symmetrical around it. Black line, strong local selection; grey line, moderate local selection; dotted line, no local selection.

