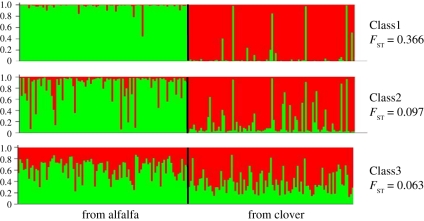
Figure 4.
Comparative analysis of population structure in the pea aphid host races on alfalfa and clover (STRUCTURE, K = 2). The proportional representation of the two clusters in each of 100 pea aphid genotypes from alfalfa is shown on the left side of each panel; results for aphids collected from red clover are on the right. Marker classes are defined in the text.

