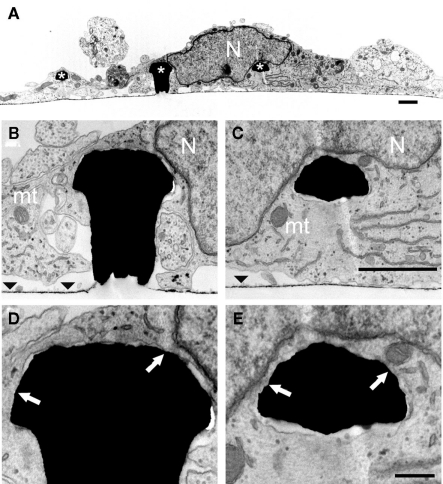
Figure 4.
TEM images of a cultured hippocampal cell engulfing three gMμPs. (A) A low magnification micrograph of a cell body engulfing three gMμPs (asterisks). (B–E) enlargements of the junctions formed between the cell and two of the gMμPs. The arrows in (D,E) point to regions of tight apposition between the cell’s plasma membrane and the PEI functionalized surface of the gMμPs. Images are from a 10-days old culture. N, Nucleus; mt, mitochondria; the horizontal straight lines in (B,C) depict area of flat gold substrate-arrowheads. Scale bar for (A–C) 1 μm and for (D,E) 250 nm.

