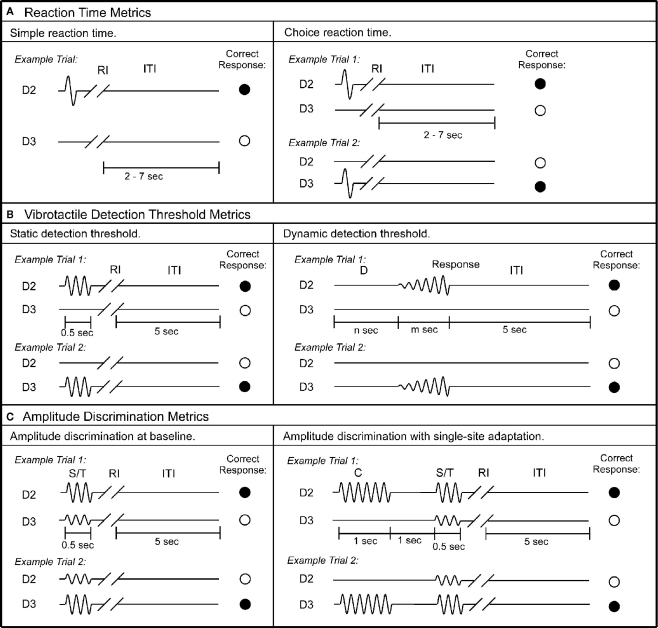
Figure 2.
Schematics of the protocols used in this study. (A) Reaction time metrics. Left panel: during each trial of the simple RT task, a single tap was delivered to D2, followed by response interval (RI). Subject was instructed to press a response button as soon as the tap was felt. After subject’s response, an inter-trial interval (ITI) between 2 and 7 s was placed before the onset of the next trial. Right panel: during each trial of the choice RT task, a single tap was delivered to either D2 or D3. Subject was instructed to select the skin site that received the tap as fast as possible. (B) Vibrotactile detection threshold metrics. Left panel: during each trial of the static detection threshold task, a 25-Hz vibrotactile test stimulus was delivered to either D2 or D3 for 0.5 s. Subject was instructed to select the skin site that perceived the stimulus. A 5-s ITI intervened between subject’s response and onset of the next trial. Right panel: during each trial of the dynamic detection threshold task, a delay period (D) (n seconds = 0, 1.5, 2, or 3 s) without any stimulation was applied. After the initial delay, a 25-Hz vibrotactile stimulus was delivered to either D2 or D3. The amplitude of the stimulus was initiated from zero and increased in steps of 2 μm/s. The stimulation was terminated with subject response to the perceived stimulus. (C) Amplitude discrimination metrics. Left panel: during each trial of the amplitude discrimination task, two 25 Hz vibrotactile stimuli – the standard (S) and test (T) – were delivered simultaneously for 0.5 s. Subject was instructed to choose the stimulus that was perceptually larger. Right panel: the amplitude discrimination task was conducted after single-site adaptation. During each trial, a 25-Hz conditioning stimulus (C) was delivered for 1 s prior to the presentation of the test and standard stimuli.

