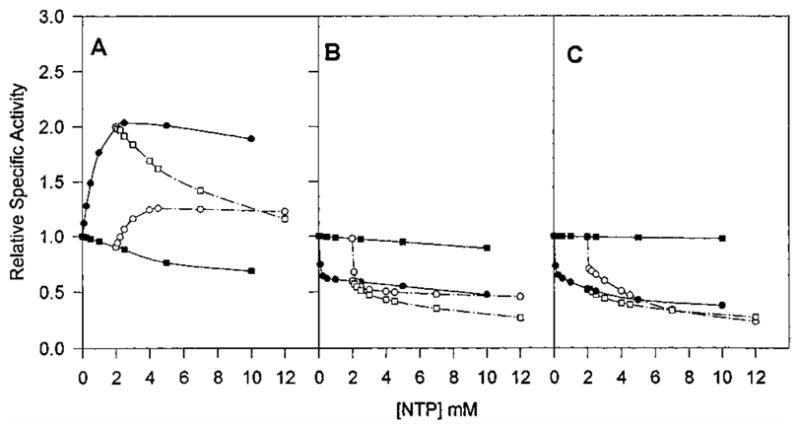
Figure 8.

CTP and UTP saturation curves in the presence of 2 mM UTP or 2 mM CTP as compared to the one in the absence of other nucleotide effectors for native Sm (A), native Ec (B), chimera SM:rS5′ec (C) ATCase holoenzyme. The saturation kinetics of the effects of varying CTP (●), varying CTP in the presence of UTP (○), varying UTP (■), and varying UTP in the presence of CTP (□) on the activity of ATCase were determined in the same way as described in Figure 5.
