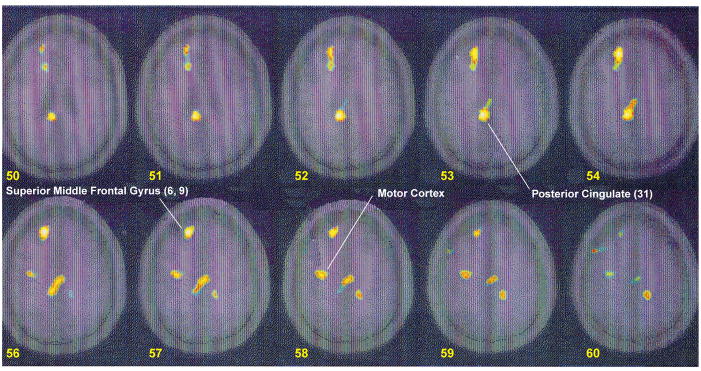
FIGURE 2. Statistical Parametric Map Overlaid on a Magnetic Resonance Image Template of Areas of Significant Interaction Between PTSD Diagnosis and Condition, Showing Areas of Relative Increase in PTSDa.
a Areas of yellow and white represent regions in which there were significant interactions between condition (traumatic versus neutral) and group (PTSD versus non-PTSD) (z score>3.09; N=88; p<0.001). Greater increases in blood flow were seen in superior and middle frontal gyrus (areas 6 and 9), posterior cingulate, and motor cortex in women with PTSD than in women without PTSD.

