Fig. 1.
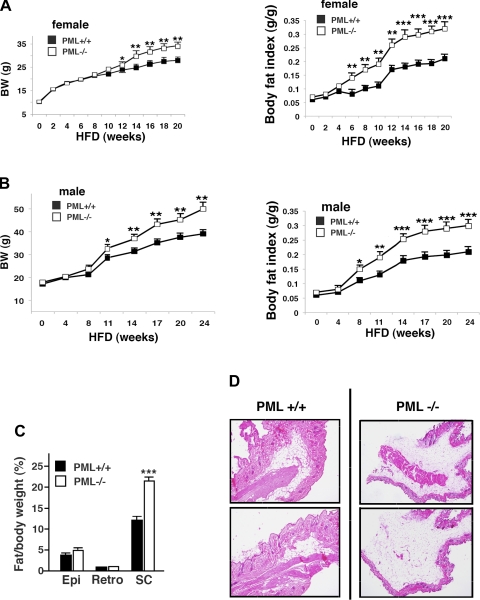
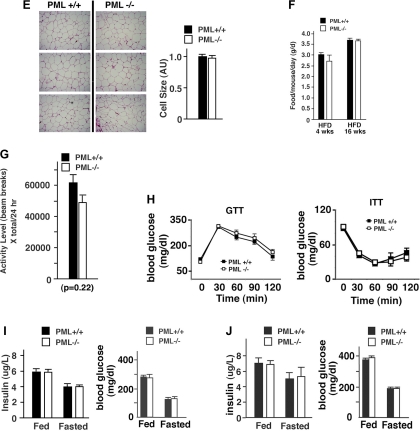
Loss of promyelocytic luekemia (PML) results in fat accumulation after high-fat diet (HFD) in mice. A: body weight (BW) and body fat index of female HFD-fed PML+/+ and PML−/− mice (n = 10–15/genotype). Body fat index was calculated by dividing the fat mass by total BW. B: BW and body fat index of male HFD-fed PML+/+ and PML−/− mice (n = 8–10/genotype). C: weights of epididymal (Epi) and retroperitoneal (Retro) fat normalized by BW. The weight of subcutaneous (sc) fat was estimated roughly by subtracting the sum of Epi and Retro fat from the total body fat and normalized by BW. Fat pads were obtained from HFD-fed male PML+/+ and PML−/− mice (HFD for 16 wk; n = 3–4/genotype). D: skin sections of the male HFD-fed PML+/+ and PML−/− mice (HFD for 24 wk) were stained with hematoxylin and eosin (H & E). Two different individual mice/genotype were used. E: histological sections of sc fat pads of male HFD-fed PML+/+ and PML−/− mice (HFD for 24 wk; left). E, right: adipocyte cell size in sc fat [arbitrary units (AU)]. For fat cell size histogram, digital images of H & E-stained adipose tissue slides were analyzed using image scope software (Aperio). Three different individual mice/genotype were used. F: food intake per mouse per day measured over 14 days (n = 5–6/genotype). Female HFD-fed PML+/+ and PML−/− mice were used (HFD for 4 and 16 wk). G: locomoter activity as measured by beam breaks/24 h using female HFD-fed PML+/+ and PML−/− mice (HFD for 16 wk; n = 8/genotype). X total indicates X total laser beam interruptions. H: glucose (GTT) and insulin tolerance tests (ITT) of female HFD-fed PML+/+ and PML−/− mice (HFD for 16–18 wk). For GTT, mice were fasted for 16 h, and 1 mg/g glucose was injected intraperitoneally. Blood glucose was measured at indicated times after injection. For the ITT, mice were fasted for 4 h before intraperitoneal injection with 0.4 U/kg of human insulin (Sigma) (n = 8–12/genotype). I: blood insulin (left) and glucose levels (right) in female HFD-fed PML+/+ and PML−/− mice (HFD for 16–18 wk; n = 8–12 of each group). Mice were either fed ad libitum or fasted (16 h). J: blood insulin (left) and glucose levels (right) in male HFD-fed PML+/+ and PML−/− mice (HFD for 40 wk; n = 8–10 of each group). Mice were either fed ad libitum or fasted (16 h). Weeks indicate weeks on HFD. *P < 0.05; **P < 0.01; ***P < 0.001.


